
Tilt funds have emerged as a compelling alternative to traditional passive and active funds. They are designed to address key challenges faced by today’s investors, particularly those with environmental, social, and governance priorities, while balancing cost, risk, and scalability considerations. This first chapter of our white paper outlines the foundations of our approach to tilt investing. To receive the full whitepaper, please enter your contact details below.
Chapter 1
Royal London Asset Management’s Equity Tilt fund range has been developed in response to a clearly defined client need: repositioning a passive equity allocation to aim to achieve meaningful carbon reductions without compromising potential returns or risk. This article explores how our tilt funds have been developed to help deliver on this promise.
In later chapters you will be able to find out more about the ways that tilt funds incorporate insights from active company engagements to aim to improve their governance profile. In theory, this should result in a portfolio of ‘better run’ companies. In the final chapter we explore the mechanics behind the creation of tilt funds and how they potentially offer efficiencies and lower running costs compared to traditional passive funds.
How Tilt funds are created: the power of many
The starting point for any tilt fund is a benchmark index. Tilt funds are constructed by applying a series of small, systematic adjustments to the chosen parent index. This index looks to represent the market’s overall risk and return characteristics. Each stock in the index is assessed for the tilt factor that is to be applied. In our case, we assess ESG factors, both quantitatively (via proprietary data) and qualitatively (by the Responsible Investing team – see Chapter 2).
But rather than making large, concentrated bets based on this research, as active funds would do, tilt funds apply numerous small positions across the portfolio. Each tilt is a modest overweight or underweight to certain companies or sectors. For example, our tilt funds will slightly reduce exposure to high-carbon emitters and increase allocation to low emitters and those that show the willingness and ability to move to a low-carbon future.
Tilts are subtle and diversified, with the aim of ensuring that, while no single adjustment dominates the portfolio, the combined effect of these adjustments creates an output that diverges from the benchmark.
Even though the over/underweight positions are relatively small (usually within +/-0.25%), by deploying them over a large number of stocks, the effect can be material.
A useful analogy when understanding the power of tilts is perhaps the marginal gains theory used in many sports. The idea is that small incremental improvements in any process add up to a significant improvement when they are all added together. Taken individually each improvement might seem insignificant, but when combined, they can have a much greater impact.
The theory has been around for many years, but was popularised in sporting circles by Sir David Brailsford, who brought the British cycling team Olympic success. He outlined the concept of improving every aspect of the training process by as little as 1%, in order to help create a significant overall improvement.
A similar theory can be used when applying tilts to benchmark constituents. When all the constituents are thoroughly analysed, their positions can be adjusted incrementally to provide a more significant change in output (success) for the investor.
When small, deliberate adjustments are made to portfolio weights based on factors such as carbon footprint, or social and governance metrics, even though each tilt on its own may appear modest, collectively they aim to improve the overall ESG profile of the fund. By applying these marginal gains it’s possible to ensure that every adjustment, no matter how small, helps contribute to a more responsible investment outcome over time. [1]
For example, let’s take a simple ten stock portfolio (based on the ten largest stocks in the Royal London UK Equity Core Tilt Fund). Purple bars represent the weighting of each stock in the benchmark and turquoise bars show the exposure in the tilted portfolio, where stocks with lower carbon scores are slightly overweighted and those with higher scores are underweighted. Although these are very small tilt positions, the cumulative effect of these is a reduction of weighted average carbon intensity of 1.5%.
Even though the individual tilts are small, the cumulative effect across all stocks results in a noticeable reduction in overall carbon exposure. This illustrates how tilt strategies aim to subtly, and effectively, align portfolios with ESG objectives while maintaining diversification. When this is extended to a benchmark containing hundreds of stocks, the effect is amplified, which can result in a material cumulative impact.
Benchmark vs tilted fund portfolio exposure to carbon intensity
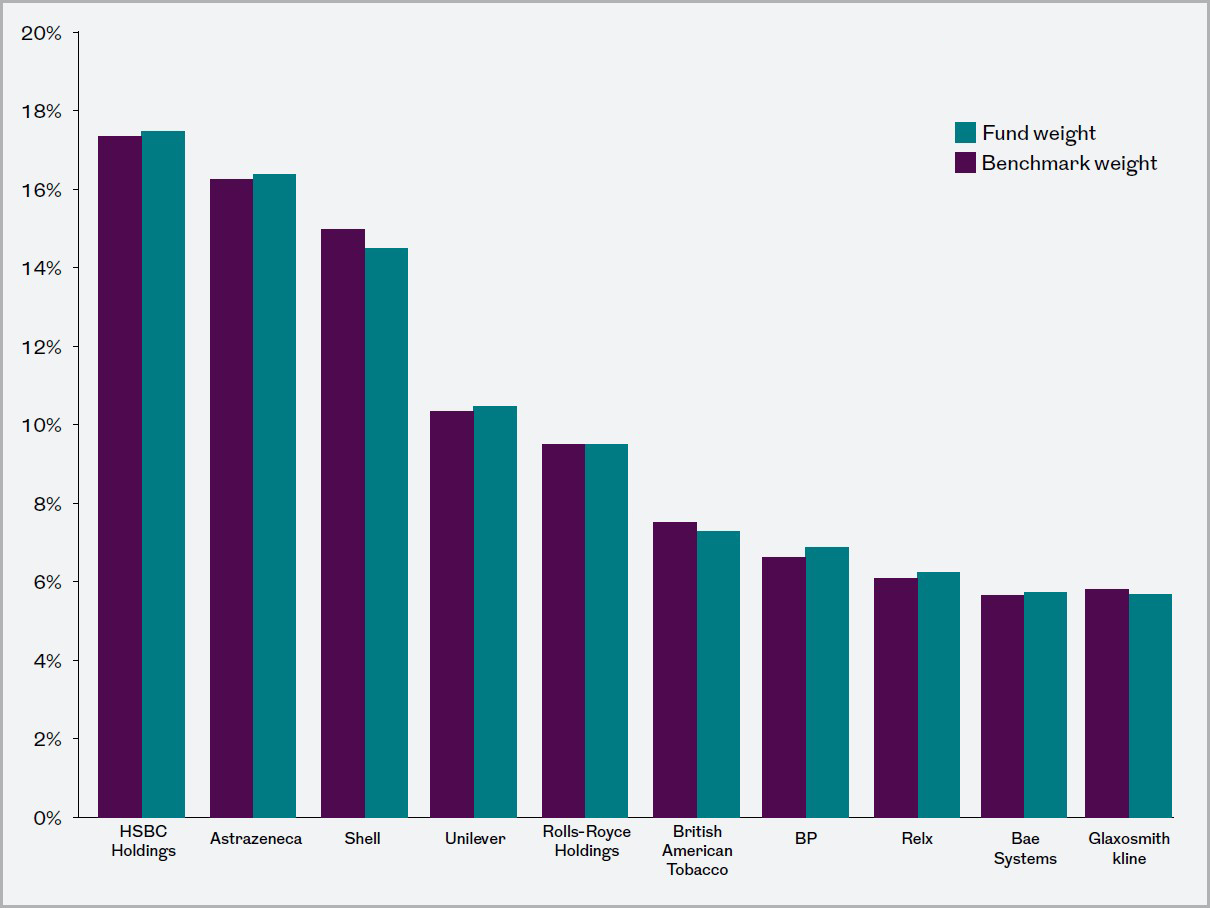
Source: Royal London Asset Management September 2025.
Portfolio characteristics and holdings are subject to change without notice. This does not constitute investments advice and is for information purposes only.
[1] Source: Royal London Asset Management 2025
Risk and reward
Aiming for risk mitigation relative to the index is a key part of tilt fund design. Tilt funds are constructed to mirror the risk profile of their parent index. By applying many small tilts rather than large exclusions or concentrated positions, they aim to avoid the pitfalls of high tracking error and unintended exposures. Investors can expect volatility similar to the broader market.
This is in marked contrast to passive ESG funds, which may produce returns that vary significantly from the benchmark index.[2] This is because the ESG factors they incorporate can lead to large macroeconomic, factor and sector biases.
Passive ESG funds are often aligned with the Paris climate agreement. These funds aim to align portfolios with the goals of the Paris Agreement, targeting a pathway to limit global warming to 1.5°C. While this supports climate objectives, it introduces higher risk compared to standard indices.
These indices typically exclude carbon-intensive sectors such as oil and gas and overweight low-carbon industries like technology and renewables, reducing diversification and increasing sector concentration risk. Significant deviations from traditional benchmarks lead to tracking error, and heightened sensitivity to ESG sentiment and political changes can amplify market volatility. While Paris-aligned indices aim to offer long-term sustainability benefits, structural differences could result in greater short-term risk compared to conventional market indices.
Meanwhile, active funds, especially those with concentrated portfolios, have the potential to become problematic as they grow. Large positions in a few companies can lead to increased risk. However, tilt funds, with their diversified approach, spread assets across hundreds of companies, aim to reduce the risk associated with any single holding. And the lower liquidity risk means customers can invest and divest as they please.
[2] ESG (In)Efficiency - CFA Institute Enterprising Investor
Putting theory into practice
Within the Royal London Asset Management Tilt funds, our approach to risk is based on achieving dual objectives. First the financial objective of replicating the benchmark index (over a rolling three-year period) is considered by ensuring that the fund includes the vast majority of the index constituents. The fund’s assets are systematically then invested to help meet their climate and ESG objectives, while aiming to mitigate risk relative to the index. (We will discuss further the ways we optimise the portfolios to reflect the benchmarks in chapter 3).
The second objective is driven by the integral part that responsible investing plays for us as a company. We have a long-established belief that investing responsibly is a way of generating improved client outcomes. Our Tilts funds help play a part in this ambition, incorporating climate and ESG-related investment criteria.
Since the launch of the funds in 2021, their main aim has been to create a weighted average carbon profile for each portfolio that is between 10-30% better than the benchmark (depending on the region). This is calculated using the Weighted Average Carbon Intensity (WACI), which is measure a of company’s CO2 emissions relative to its revenues, which is then aggregated across the portfolio in proportion to each company’s weight in the portfolio and benchmark respectively.
While the main objective of the Tilt funds is to reduce carbon intensity, we also implement broader Environmental, Social and Governance (ESG) related tilts, ensuring that our investments are not only climate aware, but also socially responsible and well-governed.
The social factors are based on taking a lower exposure to companies that fail to meet the principles of the UN Global Compact, while also reducing exposure to companies with high revenues from tobacco or nuclear weapons.
Finally, the governance factor is based on reducing exposure to companies that have poor governance practices in areas such as executive pay. (Further explanation of our governance scoring system can be found in chapter 2).
To help achieve these aims, the manager takes small positions away from the benchmark index, which generate a different return profile. This enables the Tilts funds to take active risk, which is the main differentiator from a passive fund, while aiming to mitigate macroeconomic exposures and cyclicality associated with a sector bias. Active risk is measured as the standard deviation of the difference between the fund’s return and the index over a certain time period. The active risk in relation to the index of the tilts funds is not expected to exceed 1% per annum.
The chart below shows the figures for the funds as at September 2025, demonstrating the amount of WACI reduction achieved for each fund against the tracking error at this point.
2025 - Fund WACI vs Index
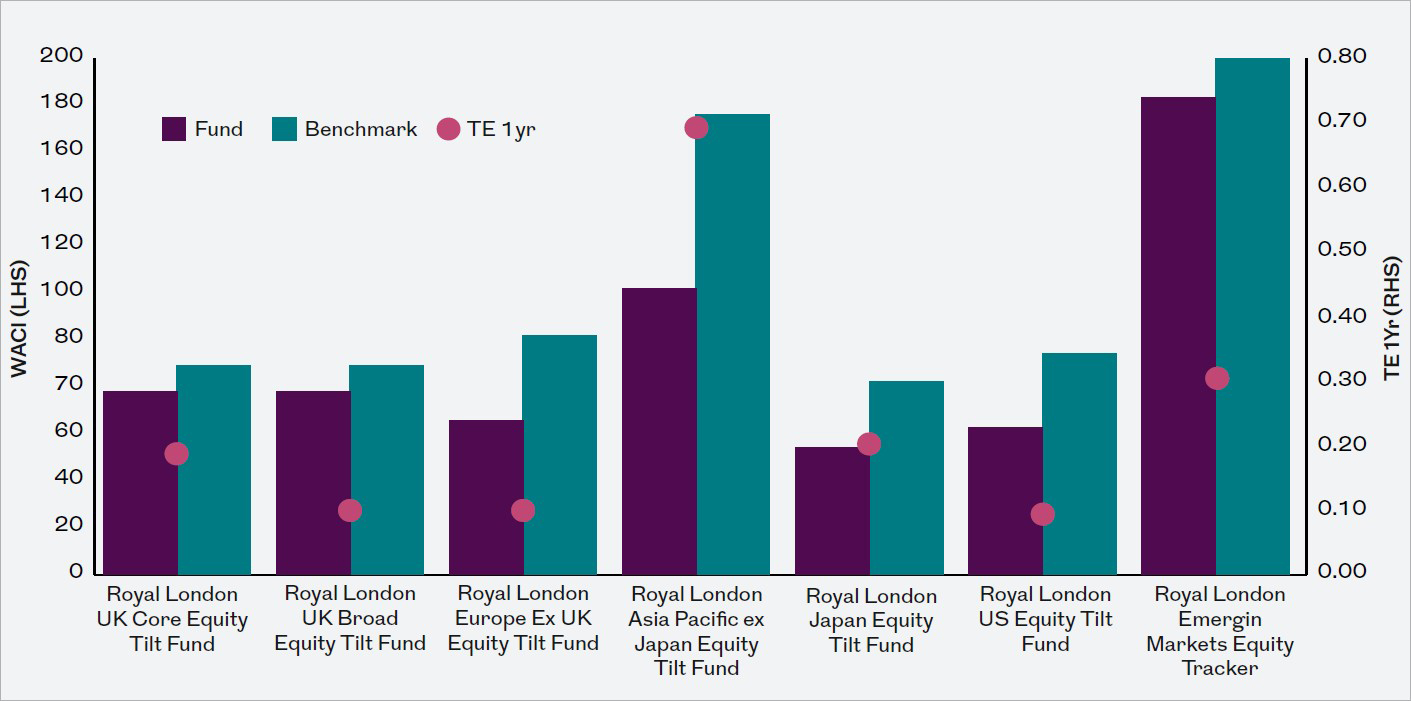
Weighted Average Carbon Intensity (WACI) measures a portfolio’s exposure to carbon-intensive companies. All direct company emissions (Scope 1 & 2) are divided by companies’ revenues, then multiplied based on their weighting within the portfolio to create a tCO2e/$m* revenue figure. Metric tonnes of carbon dioxide equivalent emissions (as defined by the GHG Protocol). Sources: Fund data, RLAM as at 31 December 2024. Carbon intensity, RLAM and MSCI. Tracking error ex-ante using APT. Certain information ©2024 MSCI ESG Research LLC. Reproduced by permission. The benchmarks for the funds are as follows: the Royal London UK Core Equity Tilt Fund benchmark is the FTSE 350 Index; the Royal London UK Broad Equity Tilt Fund benchmark is the FTSE All Share Index; the Royal London Europe Ex UK Equity Tilt Fund benchmark is the FTSE Europe ex UK Index; the Royal London Asia Pacific ex Japan Equity Tilt Fund benchmark is FTSE World Asia Pacific ex Japan Index; the Royal London Japan Equity Tilt Fund benchmark is the FTSE Japan Index; the Royal London US Equity Tilt Fund benchmark is the FTSE USA Index.
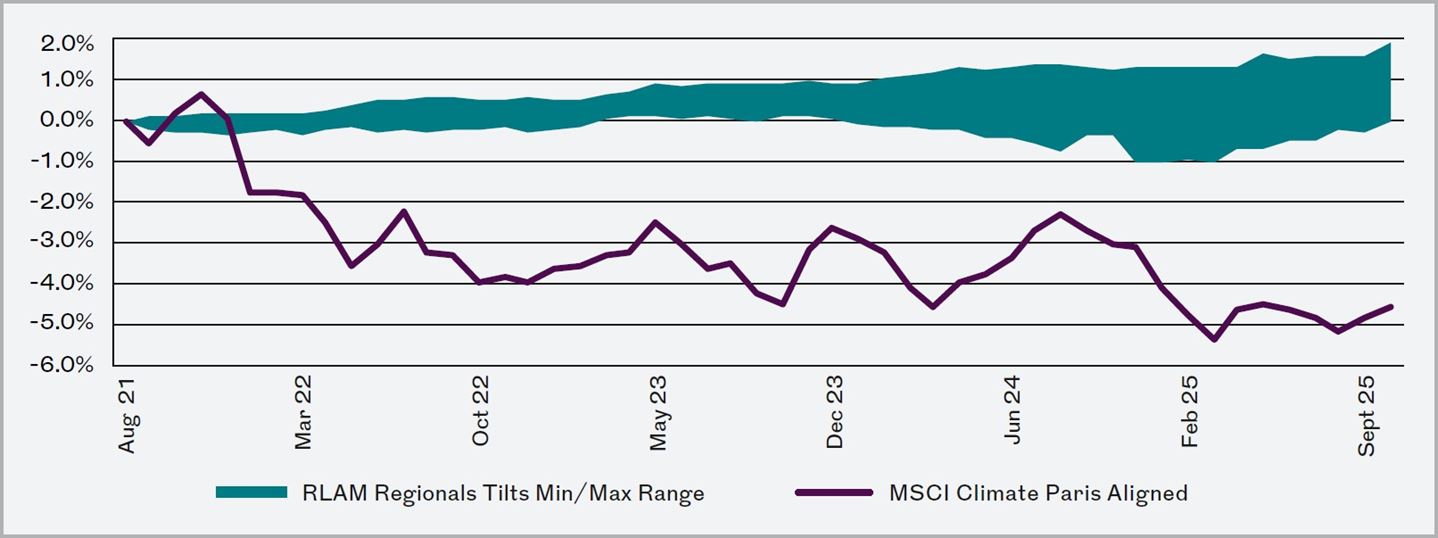
As can be seen in the chart below, the Tilts funds have also proved significantly less volatile than equivalent passive ESG funds. The volatility of the MSCI Climate Paris Aligned index has been greater, and the performance lower, than the MSCI World index. The Tilts funds have tracked their regional benchmarks much more closely (in some cases outperforming) and display much lower volatility.
Cumulative Relative Returns
|
MSCI World Climate Paris |
Average RLAM Regional Tilt (relative to regional benchmark) | |
| Annualised Return | -1.12% | 0.16% |
| Annualised Volatility | 2.12% | 0.18% |
| Information Ratio | -0.53 | 0.91 |
| Batting Average | 44% | 66% |
| Largest Relative Drawdown | -5.98% |
-0.15% |
Past performance is not a guarantee or reliable indicator of future returns. The impact of fees or other charges, including tax, where applicable, can be material on the performance of your investment. The impact of fees reduces your investment. Changes in currency exchange rates may affect the value of investment.
Source: RLAM, Morningstar as at 31 October 2025. Fund performance figures are stated gross of fees and gross of tax. Both the fund and index performance is shown at close of business prices in GBP.
New objectives – the path to net zero
As of 15 December 2025, the funds adopted new objectives of achieving a carbon footprint* reduction compared to the index. The new targets involve a 50% reduction in carbon emissions by 2030 and a target of achieving net zero by 2050, using carbon emission figures from 2020 as a baseline.
* Carbon footprint definition
Carbon footprint measures how much greenhouse gas emissions (measured in CO2e) the Fund is responsible for, based on the companies it invests in, per $1m invested in the Fund. Therefore, it is calculated by dividing the emissions attributable to the Fund by the portfolio value. The investment manager uses the most recently reported scope 1 (direct emissions from company-owned resources, like fuel combustion in vehicles) and scope 2 (indirect emissions from purchased energy, such as electricity for buildings) data, for each holding in the Fund, to calculate the carbon footprint.
The introduction of this net-zero objective is based on client feedback, which indicates investors increasingly want to measure their investment products against a forward-looking net-zero target, instead of solely backward-looking objectives that are relative in nature, and do not consider the insights into a company’s willingness and ability to reduce emissions in the future.
Alongside the addition of the net-zero focused objective, we have also taken the opportunity to simplify and make consistent the index-relative carbon objective across the fund range. We have moved these consistently to a carbon footprint of at least 10% below that of the index. This replaces the targeting weighted-average carbon intensity (WACI). The move to carbon footprint from WACI is because footprint is less susceptible to data outliers than WACI, it allows emissions to be attributed across equity and debt, and it aligns with both the Paris Carbon Accounting Financials (PCAF) and Task Force on Climate-Related Financial Disclosures (TCFD) recommendations. [3]
Clients should now be able to assess the trajectory the funds are being managed against. We recognise that clients want to see progress on climate goals before 2050, so we have added an interim target of a 50% reduction which is applicable in 2030. This choice of timeframe around the funds’ net zero objective aligns to broad industry and scientific consensus of what is required to limit global warming to 1.5°C above pre-industrial levels, as outlined in the Paris Agreement.
As things stand, the funds are on course to meet the interim 2030 and full year 2050 targets, although this is not guaranteed.[4] In the short and medium term (less than 10 years) we see the funds’ 10% improvement versus benchmark should help to provide the reduction required for net zero. Hence, we see no additional tracking error being required for the current funds and using the current process.
The prevailing trend is for the companies in our benchmark indices to decarbonise faster than required for net zero by 2050 [5]. However, were this trend not to continue, and if for some reason there was a large spike in CO2 output in the longer term (10+ years), then additional decarbonising would be required. In this scenario we may have to increase the tracking error to achieve this.
[3] E09 - Carbon footprinting - metrics.pdf
[4] Source: Royal London Asset Management 2025
Key risks
Investment Risk: The value of investments and any income from them may go down as well as up and is not guaranteed. Investors may not get back the amount invested.
Concentration Risk: The price of Funds that invest in a reduced number of holdings, sectors, or geographical areas may be more heavily affected by events that influence the stock market and therefore more volatile.
EPM Techniques: The Funds may engage in EPM techniques including holdings of derivative instruments. Whilst intended to reduce risk, the use of these instruments may expose the Funds to increased price volatility.
Exchange Rate Risk: Investing in assets denominated in a currency other than the base currency of the Fund means the value of the investment can be affected by changes in exchange rates.
Liquidity Risk: In difficult market conditions the value of certain Funds investments may be difficult to value and harder to sell, or sell at a fair price, resulting in unpredictable falls in the value of your holding.
Emerging Markets Risk: Investing in Emerging Markets may provide the potential for greater rewards but carries greater risk due to the possibility of high volatility, low liquidity, currency fluctuations, the adverse effect of social, political and economic instability, weak supervisory structures and accounting standards.
Counterparty Risk: The insolvency of any institutions providing services such as safekeeping of assets or acting as counterparty to derivatives or other instruments, may expose the Funds to financial loss.
Charges from Capital Risk: Charges are taken from the capital of the Funds. Whilst this increases the yield, it also has the effect of reducing the potential for capital growth.
For Professional Clients only, not suitable for Retail Clients. This is a financial promotion and is not investment advice. The views expressed are those of RLAM at the date of publication unless otherwise indicated, which are subject to change, and is not investment advice.