History doesn’t repeat itself, but often it rhymes. Financial markets are once again contending with a 1970s-style Middle East energy crisis that has the power to raise inflation, worsen fiscal sustainability and push the world into recession.
Deglobalisation, underinvestment, political instability and populism have made developed economies vulnerable to price level shocks that central banks are unable or unwilling to reverse. Neither stocks nor bonds do well at these times, as we saw in 2022. We believe that long-term investors should diversify broadly, including real time inflation-hedges like commodities in their portfolios. In our view, an active approach to tactical asset allocation will be more important than ever over this period as geopolitical risk ebbs and flows and the business cycle swings between boom and bust.
We believe that long-term investors should diversify broadly, including real time inflation-hedges like commodities in their portfolios.
1970s revisited
There were two inflation spikes in the 1970s, both related to interruptions to the supply of crude oil from the Middle East (Figure 1). In the Yom Kippur war and Arab oil embargo of 1973-4, the price of crude more than quadrupled. Inflation rose to 12% in the US and an eye-watering 27% in the UK as economies moved into recession. The second instance saw a tripling of the oil price from 1978 onwards caused by the Islamic Revolution in Iran. Once again, inflation spiked and the world economy slumped.
Figure 1: Increase in oil price during energy shocks
 Source: Saudi Spot oil price for the 1970s; Brent for the 2020s. The March 2026 figure is the highest intraday futures price at the time of writing. RLAM as at 24 March 2026.
The pandemic marked the start of a similar regime, in our view. Brent crude rose six-fold in price between the 2020 lockdown and Russia’s 2022 invasion of Ukraine. The percentage point increase in the rate of inflation was comparable to that seen during 1970s oil shocks in the US (Figure 2). The impact on economic activity was less severe, however, due to a lower energy-intensity and unprecedented monetary and fiscal stimulus. Even so, the return of stagflation delivered a bear market year for stocks and a generational crash for bonds, as central banks scrambled to raise interest rates from a near zero starting point.
A second 2020s cost of living surge may be under way. The US-Israeli war with Iran has seen the price of oil double year to date. If hostilities are short-lived, the inflationary impact will be manageable and financial markets will recover. If disruption continues for months or the conflict intensifies, the impact could be much more significant. According to the International Energy Agency, the closure of the Strait of Hormuz to shipping and attacks on energy facilities reduced the supply of crude oil by more than double the combined shortfalls of the two 1970s’ crises. With Qatar offline, the impact on liquefied natural gas has also been significant – double that seen in the aftermath of the Ukraine invasion.
Figure 2: US and UK inflation – the 1970s and 2020s compared
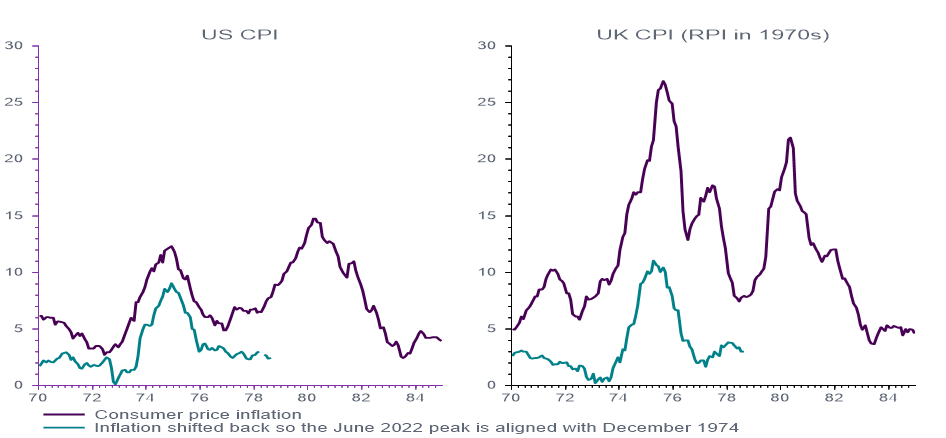
Source: LSEG Datastream as at 24 March 2026.
From a macroeconomic perspective, much will depend on what happens once the war is over. Continued instability in the region and damaged production capacity seem likely to result in higher energy prices than in recent years and this could spill over into a wide range of commodities. The cost of production for industrial metals like aluminium depends on energy. A lack of fertiliser during the growing season could see a knock-on effect on agricultural prices. Cost-push inflation raises the risk of second round effects as companies protect their margins and workers demand a pay rise. While central banks may well raise interest rates, history has shown them reluctant to inflict the monetary pain needed to reverse a large and unexpected increase in prices.
Continued instability in the region and damaged production capacity seem likely to result in higher energy prices than in recent years and this could spill over into a wide range of commodities.
The historical record
This is part of a familiar pattern seen across developed economies. UK inflation has been low and stable for most of the last century with retail prices rising by an average of about 2% a year, but there are notable exceptions. The depression years of the 1920s and 1930s saw prices drop and there were three bursts of inflation centred around the two World Wars and in the 1970s (Figure 3).
Figure 3: UK Retail Prices Index showing periods of high inflation
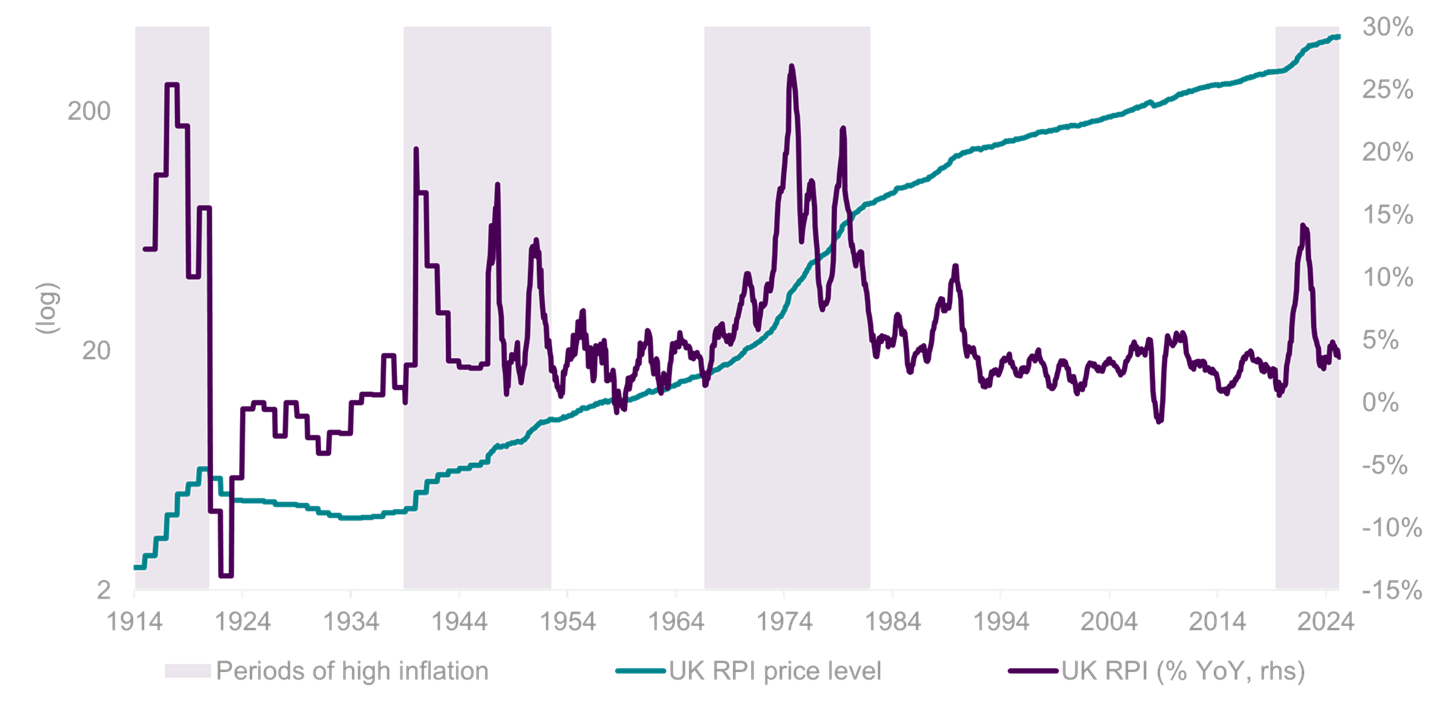 Source: Office for National Statistics. High inflation periods shaded. RLAM as at 28 February 2026.
Retail price inflation averaged about 10% in the high inflation periods but it came in the form of a series of distinct price level shocks which caused the annual rate to spike temporarily. In between these spikes, it often fell back to the low single digits, as high year-ago prices were absorbed into the base of the calculation (Figure 4).
Figure 4: High and low inflation regimes in the UK since 1915
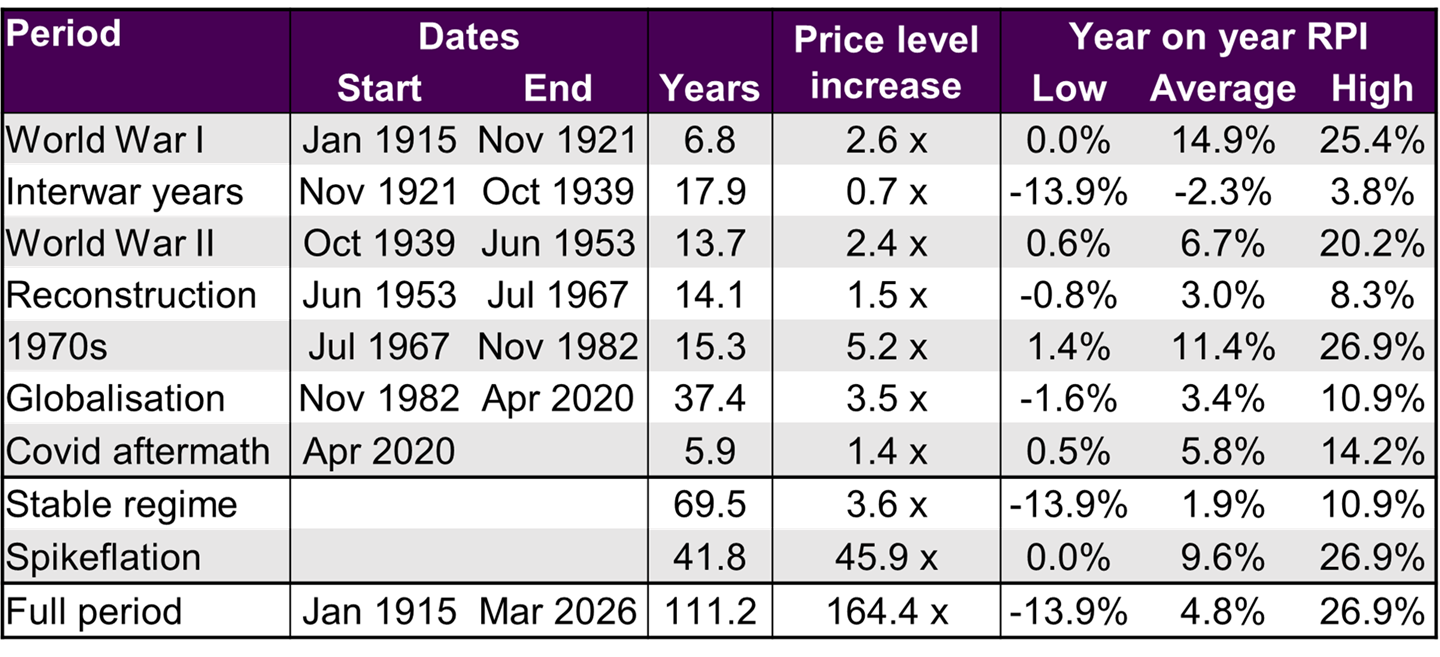 Source: Retail Prices Index, Office for National Statistics. ‘Spikeflation’ periods shaded in grey, based on RLAM classification. RLAM as at 28 February 2026.
While specific countries have suffered other periods of high and even hyperinflation, these three periods of what we call ‘Spikeflation’ were global in nature with a similar phenomenon visible everywhere. We argue we are in one of those periods again today.
A new era of Spikeflation
Profound structural changes over the last decade make the world economy prone to repeated inflation shocks (Figure 5), with the latest Middle East crisis just one example of what we expect to see in coming years.
1, Policy response to Covid pandemic
The ‘stay at home’ order during the Covid-19 pandemic necessitated wartime levels of fiscal and monetary stimulus to preserve consumer incomes and corporate cashflow. Excess stimulus was left too long in the system as the world economy re-opened, leaving too much money chasing too few goods. A new generation has been introduced to inflation and expectations are no longer anchored.
2. Chronic commodity underinvestment and net zero
Commodity prices follow long positive and negative super cycles. The Global Financial Crisis led to underinvestment across a wide range of commodities with climate change also reducing fossil fuel investment in favour of renewables. Damage to Middle Eastern oil and gas infrastructure further shifts the supply demand balance in favour of higher prices.
3. De-globalisation, trade wars and tariffs
The long period of globalisation that started with the fall of the Berlin Wall is over. Trade barriers have increased in the form of Brexit, US import tariffs set at 1930s levels and protectionism. The pandemic forced companies to bring production home despite higher costs. Supranational organisations like the United Nations, IMF, European Union and NATO find themselves under political attack from those claiming to represent a disenfranchised underclass within richer nations.
4. Structural changes to labour markets
Demographic change, with lower birth rates and an ageing population, is giving greater bargaining power to workers. Labour market flexibility has also dropped with increased political sensitivity to migration. Brexit ended European free movement. The crackdown on undocumented workers in the US is reducing the labour force, especially in the construction, agriculture and hospitality industries. Increased use of artificial intelligence could act in the opposite direction, but most likely over a longer time frame.
5. Massive public spending programmes and populism
The advent of social media has fuelled the rise of populist political parties as more extreme views are given prominence. This makes fiscal restraint harder to achieve, with embattled incumbents more likely to resort to stimulus to offset the pain of economic adjustment, even if this means higher inflation. Populist parties themselves tend to pay scant attention to fiscal rules when in power.
6. Geopolitical risk and re-armament
Previous periods of high inflation have coincided with major shifts in the balance of power between nations. Wars are inflationary as governments resort to the printing press to commandeer resources. The 1970s saw the assertion of power by those controlling fossil fuel reserves. In a similar way, Iran’s leverage today relates to the control of the shipping routes used by oil rich neighbours. Heightened geopolitical risk increases the likelihood of economic disruption and means greater spending on arms, in effect forced investment in unproductive capital stock.
7. High debt levels
The pandemic and anaemic rates of economic growth have resulted in a dramatic rise in government debt. Even in fast-growing America, the budget deficit is at a level rarely seen outside of recession. Private sector debt levels are also high after a long period of low interest rates, with much of this debt outside the regulated banking system. This makes central banking complicated. Reversing the impact of an oil price shock on the price level would require a sustained period of high interest rates, with the attendant risk of financial instability and economic collapse. Behind closed doors, governments are likely to put pressure on central banks to finance their deficits as service costs rise or to let inflation overshoot. Unexpected inflation is a tax on savers and investors in fixed income securities – but it eases the real debt burden for borrowers, governments included, and this creates moral hazard.
Figure 5: Drivers of Spikeflation
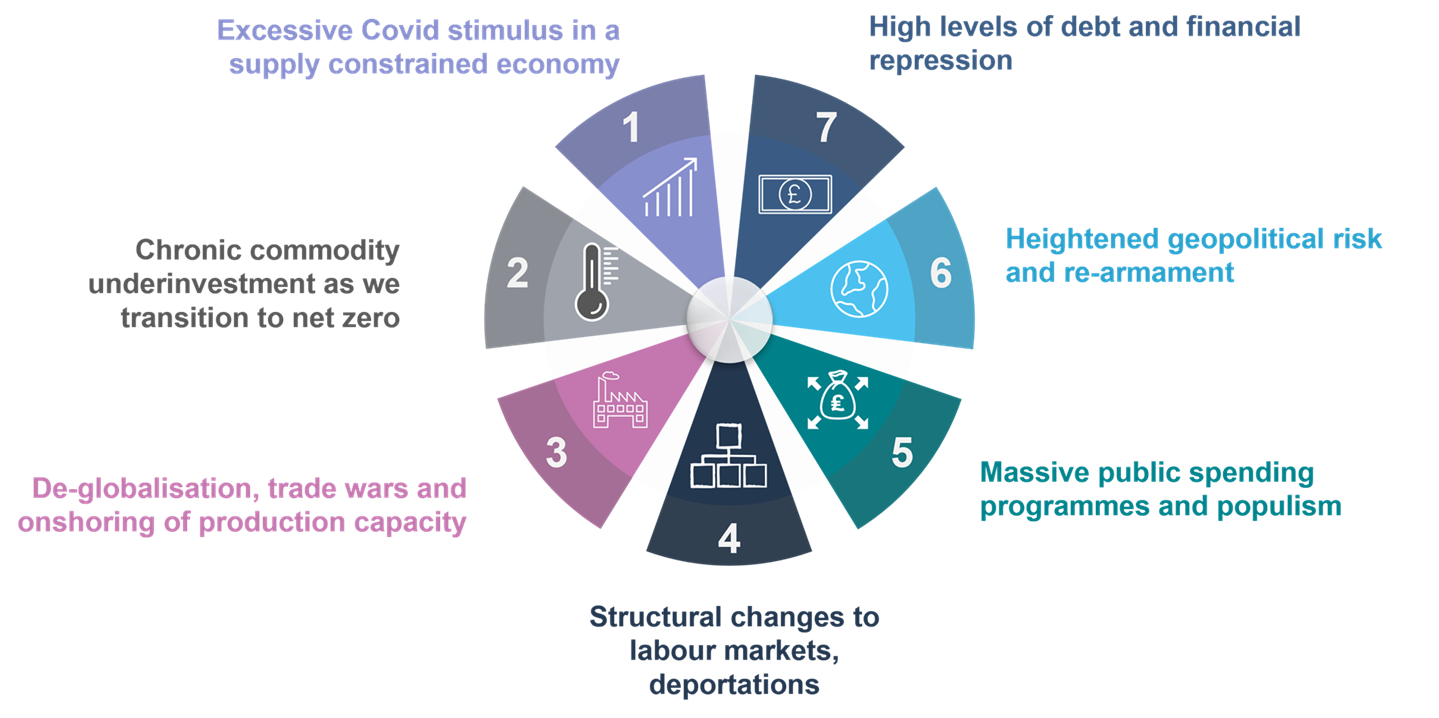
Source: RLAM, for illustrative purposes only.
We saw the interaction between high debt levels and monetary policy at work after the pandemic. The UK Consumer Price Index is up almost 30% in the six years since April 2020 versus the 12% implied by a 2% inflation target. The Bank of England raised the base rate 14 times but did not then engineer a recession to bring the price level back into line with where it should have been. It was a similar story elsewhere. In effect, central banks end up suspending their inflation targets during a price level shock. This is the monetary equivalent of dieting between meals and with similar results.
Investment implications of the new regime
Historical analysis offers some suggestions as to how investors could respond to this new environment. The Investment Clock model links financial market returns to the global business cycle. We define four phases depending on the direction of global growth and inflation. Looking at market returns since the mid-1970s, (Figure 6), we can see:
- Reflation: government bonds do best when growth is weak and inflation is falling
- Recovery: stocks do best when growth recovers, but inflation continues to fall
- Overheat: when growth is strong and inflation is rising, you’ve been better off in commodities
- Stagflation: cash is more defensive than financial assets when growth is slowing but inflation is still rising; a further sharp rise in commodity prices is also a recurring theme as we saw in 2022.
Figure 6: The Investment Clock linking markets to the business cycle
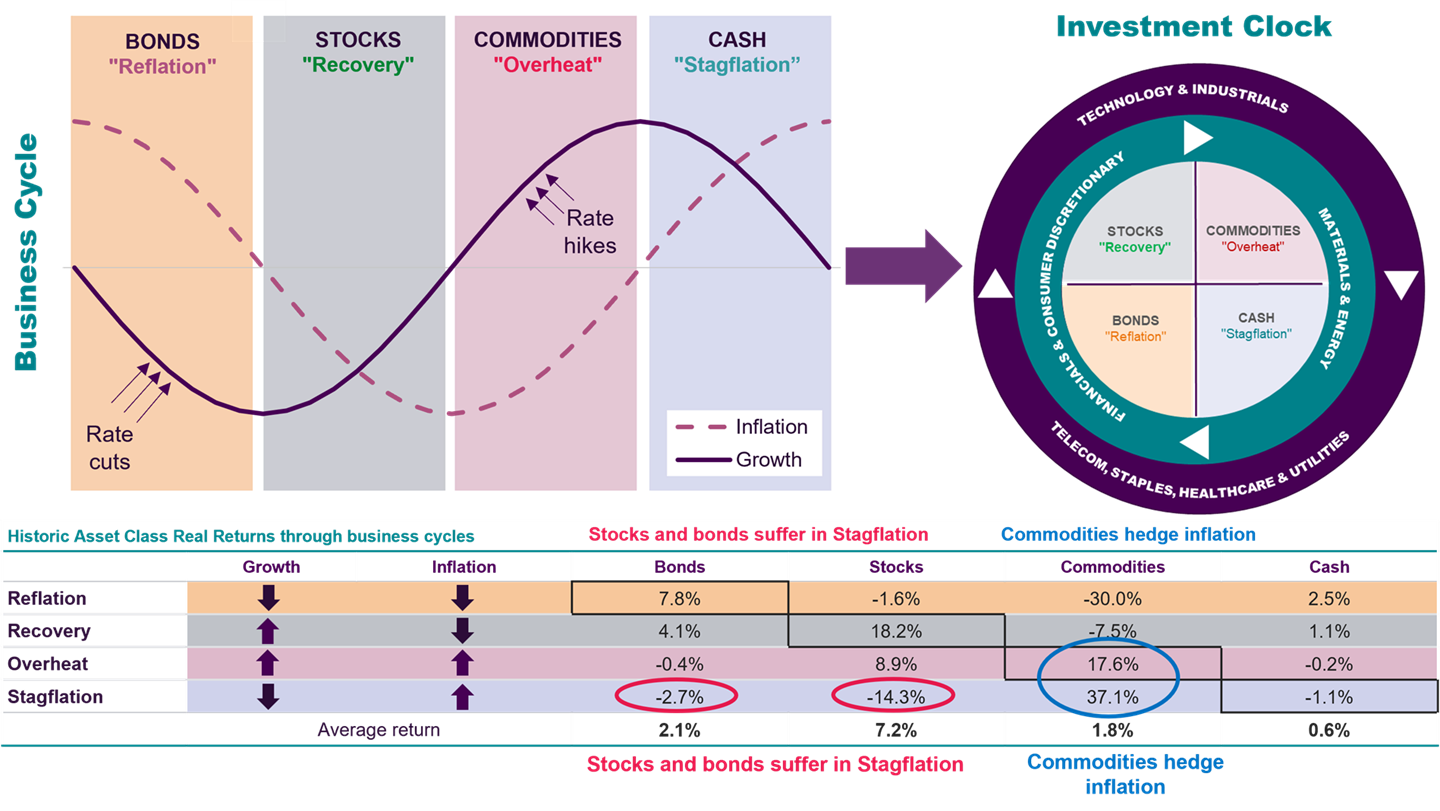
Source: RLAM as at 31 December 2025. Data based on an analysis of business cycles since April 1973.
With this framework in mind, the market response to the outbreak of war with Iran is consistent with a new Stagflation phase with both stocks and bonds selling off as commodities surge. The future path depends on what happens next.
- An early cessation of violence could see the Investment Clock back in the equity-friendly Recovery phase where it started 2026, with stocks and bonds rallying.
- A relatively contained outcome with an upturn in inflation which central banks are largely willing to look through, could see a move into Overheat, with bond yields rising and commodities continuing to do well.
- If commodity prices keep moving higher and inflation spikes, central banks would probably have to hit the brakes, moving the Investment Clock into Stagflation, with stocks in a bear market. Of the six oil price shocks since 1970, five resulted in a US recession (Figure 7).
Figure 7: Real price of crude oil with US recession bars
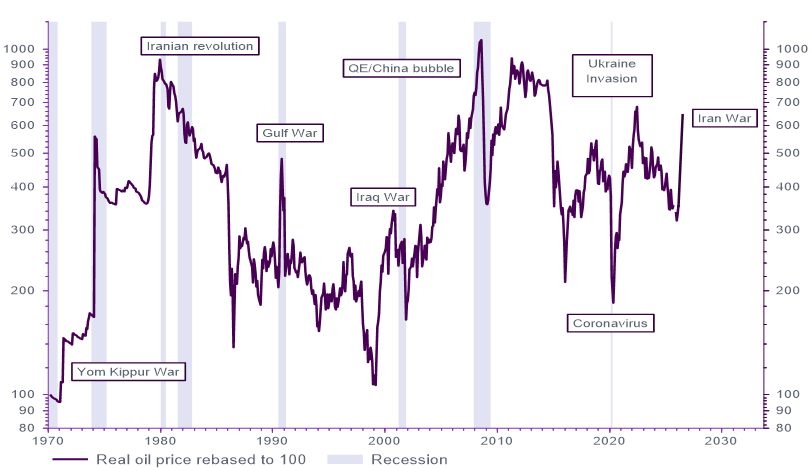
Source: LSEG Datastream as at 24 March 2026.
Diversified and active
The first lesson of history during periods of Spikeflation is to diversify broadly, including inflation hedging assets such as commodities in a multi asset portfolio. The second lesson is to be more tactical. According to the National Bureau of Economic Research, the average US business cycle since 1857 has been between four and five years in length. Periods of low and stable inflation have seen really long expansions. In an era of Spikeflation, we expect more frequent recessions and bear markets. We believe an active approach to tactical asset allocation will be more important than ever.
In an era of Spikeflation, we expect more frequent recessions and bear markets. We believe an active approach to tactical asset allocation will be more important than ever.
For professional investors only. This material is not suitable for a retail audience. Capital at risk. This is a financial promotion and is not investment advice. Past performance is not a guide to future performance. The value of investments and any income from them may go down as well as up and is not guaranteed. Investors may not get back the amount invested. Portfolio characteristics and holdings are subject to change without notice. The views expressed are those of the author at the date of publication unless otherwise indicated, which are subject to change, and is not investment advice.